
I brought back another old feature from 3rd Degree this week, the FC Dallas Year by Year records. While I was working on it I started noticing a few odds and ends worth sharing.
Let’s have some fun.
The Good
Most fans might think that the best FC Dallas season in history is 2016 when the club won both the US Open Cup and the Supporters shield. Certainly, in trophies, that’s true, it’s the best.
But statistically, the best season in FC Dallas history might be 1999.

You see in 1999 MLS had the shootout. So there were no ties and that meant the chance for more wins (and losses) than in later seasons. As a result, in 1999 FC Dallas earned 19 wins – their best win total in franchise history – but just 51 points as a shootout win was less points than a regulation win.
But the Burn also earned their franchise-best goal differential in 1999 at +19. That happens when you score 54 goals and allow only 35 – both totals the 2nd best each in franchise history. Jason Kreis was the first American born MVP that year and had the first 15+ goal, 15+ assist season in MLS history.
To recap the 1999 bests…
Most wins – 19
Best goal differential – +19
So you say shootouts are a “cheat” and ’99 shouldn’t count? All right, fair enough.
Then 2016 still isn’t the club’s best season statistically. 2015 is, the year FCD tied New York Red Bulls on 60 points. You see in the 2015 season, FCD had 1 more win (18, 2nd most), 2 more goals scored, and 1 less goal allowed than 2016. That’s a +13 to +10 goal differential. So 2015 wins.
Most points: 2015-2016 – 60
Most points per game: 2015 and 2016 – 1.76
Not much more to say about the two best point totals in franchise history.
Biggest one-season improvement in goal differential? 1998 to 1999 – +35
What a swing. From -16 in 1998 to +19 in 1999. Again with the ’99 greatness.
1998 was a low’ish 43 goals scored and a 2nd worst ever 59 goals allowed. Oscar Pareja came in at the end of the season and Kreis (9g/8a) didn’t get much scoring help. In 1999 Kreis exploded to 18g/15a (6 game-winning goals, 7 game-winning assists), Pareja had a full season working with Chad Deering, and Ariel Graziani came in late that year. Matt Jordan took over in goal and posted a 1.07 gaa.
The 2nd biggest improvement in goal differential is 2004 to 2005 under Colin Clarke. From -11 in 2004 to +8 in 2005 a +19 GD improvement.
Here are some more bests… led by 2010, the year of the best playoff run. All the way to MLS Cup.
Most ties? 2010 – 14
That was a never say die team with a stingy defense, you never felt they were out of a game.
Fewest losses? 2010 – 4
Same reason, scrappy team. They hated to lose. 2nd fewest? 2016 with 8.
Fewest goals allowed? 2010 – 28
Yup, that team had some fight in it. 2010 was a heck of a team.
Most goals? 1997 and 2014 – 55
2014 goal scorers – Blas Perez (11), Fabian Castillo (10), Michel
(8), Tesho Akindele (7)
1997 goal scorers – Dante Washington (12), Damian Alvarez (11), Jason Kreis
(8), Gerrell Elliott (7)
By the way, runner-up most goals seasons with 54 goals scored are 1999, 2000, and….
Wait for it…
2019.
As much as we complain about the lack of a great goal scorer, FCD still tied for the club’s second-best goal-scoring season last year. Amazing as it is in hindsight.
To be fair, the discussion of the lack of a great 9 is about winning a title, not beating the franchise season goals record.
Number of 1st-in-Conference seasons? 3
Pareja’s two 60 point seasons, 2015 and 2016, and…
2006. The year Colin Clarke got fired after a first-round playoff upset against Colorado. Still one of the dumbest decisions in franchise history. Just three 1st place finishes in 24 years and the only 1st place finish in the first 19 years of the franchise, and they fired the guy. Unreal.
Number of seasons missing the playoffs? 7 seasons
Number of seasons making the playoffs? 17 seasons
Number of seasons with a negative goal differential: 6
Strangely, FCD missed the playoffs in ’08 and ’09 despite having a positive goal differential both seasons and made the playoffs in ’98 and ‘07 despite being -16 and -7 in GD.
How FCD finished 3rd in the West and notched 13 wins in 2007 with a -7 goal difference is hard to figure although the close to record low 37 goals scored is, I’m sure, a factor.
One last “good” note…
FC Dallas takes the US Open Cup seriously and often makes deep runs. Twice they have won the thing and twice been runner up. They have a +25 goal differential in all-time Open Cup play – 121 goals for and 96 goals against. 40 wins and 22 losses. That’s some pretty good Cup numbers.
All-Time Averages
Average finish in the standings? 3.8
So just better than 4th place. Which is terrific in the era of 12 teams but wasn’t so great when there were just 4 to 6.
All-Time ppg: 1.42 (318-287-159 record)
Average points per season: 45
All-time goal differential: +42 (1134 goals scored, 1092 goals allowed)
The answer to the ultimate question of life, the universe, and everything. What a time to be alive.
Average record: 13-12-7 (32 games average)
So slightly above .500.
Neither good nor bad.
Fewest ties? 2000 and 2006 – 4
This isn’t counting the shootout era obviously when there were 0 ties for the first four seasons in MLS.
Few ties can be good or bad, depending on if you are turning them into wins or losses. 2006 was Clarke’s 1st place season so they clearly turned them into wins with 16 wins for 52 points. 2000 was a 46 points season where the Burn finished 3rd out of 4 teams and Dave Dir got fired.
You could say the same of having a lot of ties, sometimes it’s good like in 2010 (see above), sometimes it’s bad like in 2012 (12 ties but only 9 wins), 2008 (12 ties and only 8 wins), or 2017 (13 ties and only 11 wins).
One Oddity
Fewest games played? 2001 – 26
9/11 shortened the MLS season. Surprisingly, 2001 isn’t the lowest goals scored or goals allowed despite being as much as 8 games shorter than seasons are now.
The Bad
The statistically worst season in franchise history, I’m sure you can all predict: 2003 in Southlake. It holds some dubious records.
Fewest wins – 6
Most losses – 19
Fewest points – 23
Worst ppg – 0.77
Most goals allowed – 64
Worst goal differential – -29
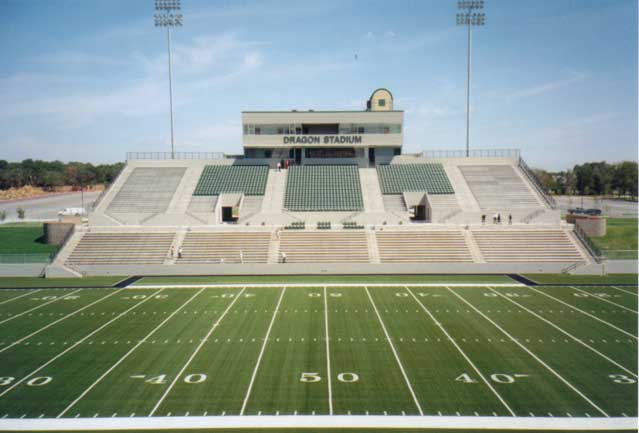
The 2nd worst goals scored by just one goal (35 goals) keeps 2003 from being the unanimously worst season in franchise history. I don’t put all of it on Mike Jeffries though, he was doomed the minute the move to Dragon Stadium happened. Then Ronnie O’Brien had his leg broken by Demo Kovalenko and Kreis tore his ACL. What an unmitigated disaster that season was and you can put it on the Hunts and HSG.
Since all that bad above is one season, the 2nd worst of each of those stats is worth a look.
2nd fewest wins – 8 (2008, when Steve Morrow was let go midseason.)
2nd most losses – 17 (1998, Dir’s bad season in the shootout era.)
2nd worst ppg – 1.15 (2012, Schellas Hyndman’s 2nd to last season. David Ferreira broke his foot)
2nd most goals allowed – 59 (1998, again Dir bad season.)
2nd worst goal differential – -11 (2004, Clarke’s first full season trying to rebuild from Southlake.)
2nd fewest points – 35
I separated this one out of the list because that 2nd worst 35 point season was 2001, the shortened season due to 9/11, which is kind of cheating this category. After 2001, it’s a tie on 36 points between 2004 – Clarke’s first full season, the start of post-Southlake rebuilding – and 2008 – the season Morrow got let go and Hyndman brought in.
Largest one season goal differential decline? 2002 to 2003 – -30
FCD wasn’t great in 2002 but had been improving a little under Jeffries for two seasons and both seasons were +1 GD. But the -29 in Southlake is so ugly. The team went from mediocre to really, really bad. Southlake strikes, again!
The 2nd largest GD decline is from 1997 to 1999, + 6 to -16. That’s a -20 GD drop. If not for 2003/Southlake, we’d be talking about 1998 as the worst season in club history. Which was amazingly followed by one of the best in 1999. Dir went down -20 in goal differential and then back up +35 in a three-season span. Mindboggling.
Despite had bad 1998 was, the Burn finished 4th out of 6 teams in the West and made the playoffs. You have to love early MLS sometimes
Fewest goals scored? 2004 – 34
2004 goal scorers – Eddie Johnson (12), Tony Nhleko (6), Jason Kreis (5), three players (2). Kreis was coming off the torn ACL of 2003 (thanks Southlake!) so it’s amazing he even had 5.
Number of last-in-conference seasons? 2
2003 and 2004. Southlake took a while to recover from. Man alive, Southlake was insane! It’s amazing, really, that this franchise as only finished last twice and it’s because of that stupid move.
One last bad note…
Unlike the Open Cup (see above) the MLS Cup Playoffs… yeah, not so good for FC Dallas. It’s an all-time record 13-23-8 with 60 goals scored and 81 goals allowed for a -21 goal differential. The Huntsmen have made it to the MLS Cup Final just once, where they got hacked and thugged out of a title in 2010.
Playoffs are not this franchise’s thing.
How many ties did we have in the shootout era? I think that that would be a good part to know and then add on to that how many of those were turned into a win.
I have that info somewhere, I’ll see what I can do with it.
Edit: I added the info to the year by year page.
but to sum up…
1999 gets you a 16-7-9 which is 3rd most wins, and 57 points, tied 3rd in points… but more importantly, it jumps the PPG up to 1.78 making it the best season in that regard.
1998 is still but just not quite so much. 11-15-6 and 39 points. Slightly better at 1.22 per game. Still not a great year.